HVAC Business Profit Margins: What the Numbers Should Look Like at $1M–$5M
If you run an HVAC business and you've ever wondered whether your margins are normal — or whether you're leaving money on the table — you're not alone. It's one of the most common questions we get from HVAC owners doing $1M–$5M in revenue.
"We're busy all the time. The trucks are running. The phones are ringing. So why does it feel like there's never enough money at the end of the month?"
The answer almost always lives in the margins. Not because the business isn't generating revenue — but because most HVAC owners don't have clear benchmarks for what healthy margins actually look like at their size, and they have no way to know whether their numbers are normal, below average, or quietly bleeding profit.
This post breaks down HVAC profit margin benchmarks by revenue size, explains what drives the difference between a 5% net margin and a 15% net margin, and gives you the specific numbers to measure yourself against. Then we'll talk about what actually moves the needle.
Why HVAC Margins Are Different From Other Trades
HVAC is one of the more financially complex trades to run profitably — and the margin structure reflects that. Unlike roofing (which is largely project-based) or electrical (which tends to be more predictable per-job), HVAC has a hybrid revenue model: emergency service calls, planned maintenance agreements, equipment installations, and commercial contracts all operate with different cost structures, different margins, and different cash flow profiles.
This complexity is actually an advantage for owners who understand it — because it means there are multiple levers to pull. But it's a trap for owners who aren't tracking which revenue streams are actually profitable, because the blended average can look fine while one or two lines of business drag everything down.
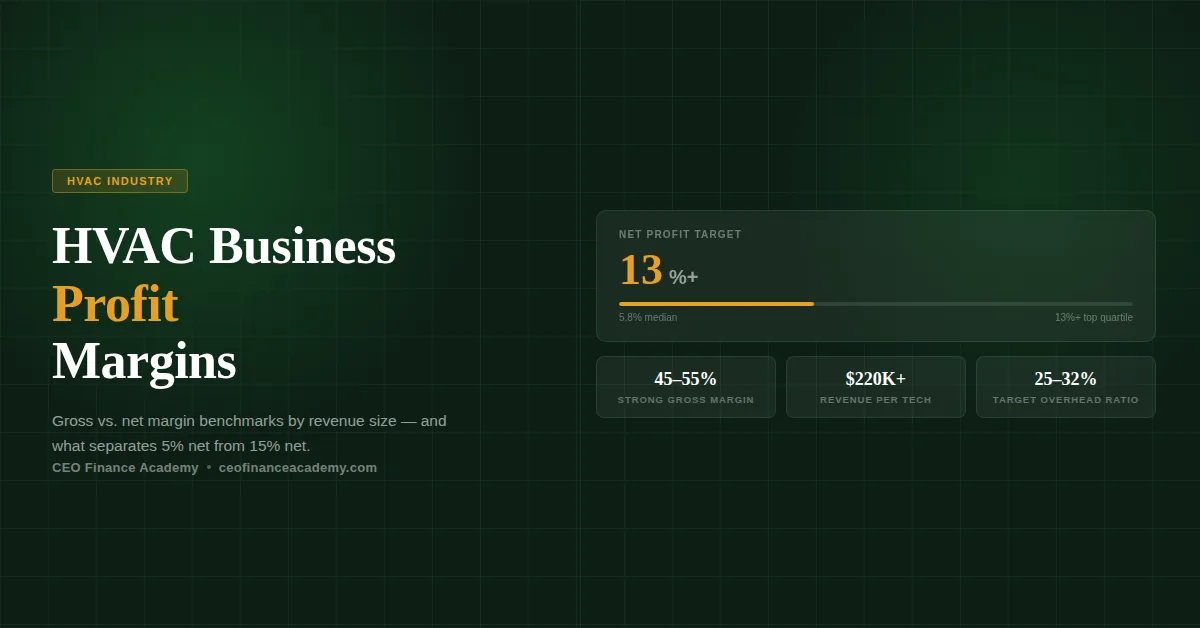
According to the 2024 ACCA Financial Benchmarking Study, the median net profit margin for HVAC contractors was 5.8% — but the top quartile averaged 13.2%. That 7+ point gap doesn't come from doing more work. It comes from knowing which work to do, how to price it, and how to control costs at the job level.
The goal of this post is to show you where you stand relative to those benchmarks — and give you a clear picture of what changes when you move from median to top quartile.
HVAC Profit Margin Benchmarks: The Core Numbers
Here are the key margin benchmarks we track for HVAC clients at CEO Finance Academy, broken down by performance tier:
| Metric | Needs Work | Average | Strong | Best-in-Class |
|---|---|---|---|---|
| Gross Profit Margin | Below 35% | 35–45% | 45–55% | Above 55% |
| Net Profit Margin | Below 5% | 5–8% | 8–13% | Above 13% |
| Overhead Ratio (% of revenue) | Above 40% | 32–40% | 25–32% | Below 25% |
| Labor Cost (% of revenue) | Above 35% | 28–35% | 22–28% | Below 22% |
| Parts & Materials (% of revenue) | Above 30% | 22–30% | 18–22% | Below 18% |
| Maintenance Agreement Revenue (% of total) | Below 5% | 5–15% | 15–25% | Above 25% |
A few important notes on these benchmarks:
- HVAC gross margins are higher than most trades because labor and materials are both included in cost of goods. A 45% gross margin in HVAC is not the same as a 45% gross margin in roofing — the cost structure is different.
- Overhead ratio is where most HVAC companies lose the margin game. It's common to see gross margins of 48% bleeding down to a 4% net because overhead is running at 44% of revenue unchecked.
- Maintenance agreement revenue is one of the clearest indicators of business maturity. It's recurring, predictable, and comes with a dramatically lower cost of sale than new installs — which is why top-quartile HVAC companies prioritize it.
Profit Margins by Revenue Size: What to Expect at Each Stage
Margins don't stay constant as an HVAC business grows. Here's what healthy looks like at different revenue levels — and where the common traps appear at each stage:
| Metric | $500K–$1M | $1M–$2.5M | $2.5M–$5M | $5M–$10M |
|---|---|---|---|---|
| Gross Margin | 40–52% | 42–54% | 44–56% | 42–54% |
| Net Margin | 6–12% | 7–13% | 8–15% | 7–13% |
| Overhead Ratio | 30–40% | 28–38% | 28–36% | 30–40% |
| Owner Salary (in overhead) | $80–$140K | $120–$180K | $160–$240K | $200–$320K |
| Technicians per $1M revenue | 3–4 | 2.5–3.5 | 2–3 | 2–2.5 |
Notice that net margin actually peaks in the $2.5M–$5M range — not at the top. This is the sweet spot where overhead is spread over enough revenue to be efficient, but the business hasn't yet added the management layers and fixed costs that compress margins at $5M+. The companies that maintain strong net margins above $5M are doing so through deliberate overhead management — it doesn't happen automatically.
The most dangerous assumption in HVAC is that more revenue automatically means more profit. We see $4M companies netting 12% and $8M companies netting 4%. Revenue is not the variable. Systems are.
The 5 Margin Killers Specific to HVAC Businesses
When HVAC owners come to us with margin problems, it almost always traces back to one or more of these five patterns. None of them are obvious from a standard monthly P&L — which is why they persist for years without getting fixed.
1. Pricing That Hasn't Kept Up With Labor and Parts Costs
Labor costs in the trades have increased significantly over the past three years. Technician wages that were competitive at $28/hour in 2021 are now $36–$42/hour for experienced techs in most markets. Parts and equipment costs have followed similar inflation curves. The problem: many HVAC owners haven't updated their pricing systematically to reflect these changes. They've absorbed the cost increases in their margins without realizing it, because the revenue line kept growing while the cost structure silently outpaced it.
The fix isn't just raising prices. It's building a pricing model that starts with your actual labor burden rate, materials cost, overhead allocation, and target net margin — then works backward to your service rates. Most HVAC owners price by gut feel or competitor reference. Neither tells you whether the job is actually profitable at current costs.
2. Dispatching Low-Margin Calls at the Same Rate as High-Margin Calls
Not all HVAC service calls are created equal. A maintenance visit on an aging system in a home with a service agreement is a high-margin, high-conversion opportunity. An emergency call in a remote area for a brand the company doesn't typically service is often a low-margin, high-cost drain. The problem is most HVAC dispatchers don't factor margin into the dispatch decision — they route by geography and availability. Companies in the top quartile deliberately route their best technicians to the highest-conversion opportunities and have a clear strategy for handling low-margin calls, including which ones to decline.
3. Technician Efficiency Below Target
Revenue per technician is one of the clearest indicators of operational health in HVAC. The target range for a fully burdened technician (salary, benefits, truck, insurance) is $200K–$280K in annual revenue generated. Below $180K and the math stops working — you're paying more for the technician and their overhead than they're generating in gross profit. This number varies by market and service mix, but most HVAC owners don't track it at all. They know their total revenue and their total headcount, but not the ratio — and they can't make good hiring decisions without it.
4. Overhead That Scales With Revenue Instead of Staying Fixed
The goal with overhead is to keep it as fixed as possible while revenue grows — so that every dollar of new revenue contributes more margin. The trap: in fast-growing HVAC companies, overhead often scales proportionally with revenue. New admin staff, bigger office, more vehicles, a service manager, marketing spend. Each hire and expense feels justified individually. But when overhead grows from 28% to 38% of revenue as the company scales from $2M to $4M, the owners are working twice as hard for the same or lower net margin. The discipline is to model the overhead cost before making the hire — not after.
5. No Visibility Into Job-Level Profitability
This is the root cause behind most of the others. If you don't know which jobs, which technicians, which service types, and which geographic areas are actually generating margin — you can't make good decisions about any of them. You'll keep dispatching to low-margin calls, keep the underperforming technician, keep doing the residential installs that look profitable but aren't once you account for the call-backs and warranty work. Job-level profitability isn't a nice-to-have in HVAC. It's the foundation of everything.
Every one of these margin killers is a visibility problem before it's a management problem. You can't fix what you can't measure. The HVAC companies operating at 12–15% net margins aren't luckier or working harder — they have better financial systems that show them exactly where the money is going at the job level.
Not Sure Where Your HVAC Margins Stand?
Book a free Cashflow Forecast Call with our team. We'll look at your numbers together and show you exactly where your margins are leaking — and what it would take to fix them.
→ Book My Free CallNo sales pressure · Just an honest look at your numbers
What Separates 5% Net From 15% Net in HVAC
We've worked with enough HVAC companies to know that the difference between a 5% net margin and a 15% net margin is almost never about revenue. The $3M HVAC company netting 5% and the $3M HVAC company netting 15% are often doing roughly the same volume of work, serving similar markets, paying similar wages. The difference is almost entirely in financial systems and management discipline.
The 5% company typically looks like this:
- Prices set by gut feel or competitor reference — not by actual cost structure
- No tracking of revenue per technician or job-level profitability
- Overhead that grew proportionally with revenue — never audited
- No maintenance agreement program or one that's underdeveloped
- Owner reviewing monthly P&L at best, with no rolling cash forecast
- Paying themselves whatever's left over at end of month
The 15% company typically looks like this:
- Pricing model built on actual labor burden rate, materials cost, and target margin
- Revenue per tech reviewed monthly — clear target of $220K+ per tech per year
- Overhead audited quarterly, with specific targets by category
- Maintenance agreements representing 20%+ of revenue — recurring, high-margin, low cost-of-sale
- Rolling 13-week cash forecast reviewed weekly
- Owner salary structured as a fixed overhead line, not a variable draw
The transition from the first profile to the second doesn't require a complete business overhaul. In our experience, the highest-leverage moves are job-level profitability tracking, a pricing model rebuild, and overhead ratio targeting. Those three changes alone typically move net margin by 4–6 points within 12 months.
How to Calculate Your HVAC Business Profit Margin
If you want to benchmark your own numbers against the tables above, here's how to calculate each metric from your financials:
Gross Profit Margin
Formula: (Revenue − Cost of Goods Sold) ÷ Revenue × 100
In HVAC, Cost of Goods Sold includes direct labor (technician wages and burden), parts and materials, subcontractor costs, and vehicle costs directly tied to jobs. It does not include management salaries, office rent, marketing, or admin overhead.
Net Profit Margin
Formula: Net Income ÷ Revenue × 100
Net income is what's left after all costs — COGS and overhead — are deducted. If you're an S-Corp or pass-through, make sure your own salary is included as an overhead expense before calculating this. Many HVAC owners inflate their apparent net margin by not paying themselves a market salary — which makes the business look more profitable than it is.
Overhead Ratio
Formula: Total Overhead Expenses ÷ Revenue × 100
Overhead includes everything that isn't a direct job cost: owner salary, admin staff, office rent, insurance, marketing, software, vehicles not tied to specific jobs, and any other fixed operating costs. This number should be reviewed monthly — not just at year end.
Revenue Per Technician
Formula: Total Revenue ÷ Number of Revenue-Generating Technicians
Count only field technicians who generate billable revenue — not managers, dispatchers, or admin. Target: $200K–$280K per technician annually. If you're below $180K, the math on that technician's fully-burdened cost likely doesn't work.
Building a More Profitable HVAC Business: Where to Start
If your margins are below the benchmarks above, here's the order we'd recommend attacking the problem:
- Build a job-level P&L. Before you can fix margins, you need to see them at the job level. Set up your accounting to track direct labor, parts, and subcontractor costs by job type — not just in aggregate. Even a rough job-level view will show you where the money is going.
- Rebuild your pricing from actual costs. Calculate your fully-burdened labor rate (wage + payroll taxes + benefits + truck + tools). Add your parts cost at actual, not estimate. Add an overhead allocation percentage. Then set your target net margin on top. This is your floor — not a ceiling.
- Set a maintenance agreement revenue target. If you're below 10% of revenue from maintenance agreements, make growing that number a primary goal. Aim for 15–20% within 18 months. The margin improvement will compound.
- Audit your overhead by category. Pull every line item in your overhead. Ask: is this cost growing our revenue or just growing our cost structure? Set a target overhead ratio (25–32% is realistic for a well-run HVAC company at $1M–$5M) and measure against it monthly.
- Review revenue per technician quarterly. Set a target, communicate it to your operations team, and identify what's driving variance when you're below it — dispatch efficiency, call type mix, parts availability, or technician skill gaps.
The Bottom Line on HVAC Profit Margins
If your HVAC business is generating solid revenue but thin margins, you are not alone — and you are not failing. The median HVAC company runs at 5–6% net. The gap between median and top quartile (13%+) is real, but it's not mysterious. It's built on better visibility into job-level profitability, pricing that reflects actual costs, overhead that's actively managed, and a maintenance program that generates recurring margin.
None of these changes require you to work harder. They require you to work with better financial systems. And that's exactly what we build with HVAC owners at CEO Finance Academy — the CFO layer that your accountant and bookkeeper were never meant to provide.
- Know your gross margin by job type — not just in aggregate
- Price from actual cost structures, not gut feel or competitor rates
- Track revenue per technician and set a clear target
- Build maintenance agreement revenue toward 20%+ of total
- Audit and target your overhead ratio every quarter
- Review your P&L monthly with someone who can tell you what it actually means
If you want to know exactly where your HVAC business stands against these benchmarks — and what your biggest margin opportunity is — that's what our free Cashflow Forecast Call is for.
Ready to Know What Your HVAC Margins Should Look Like?
Book a free call with our team. We'll look at your numbers together and show you where your biggest margin opportunities are — and exactly what it would take to capture them.
→ Book My Free CallFree call · No sales pressure · Just an honest look at your numbers