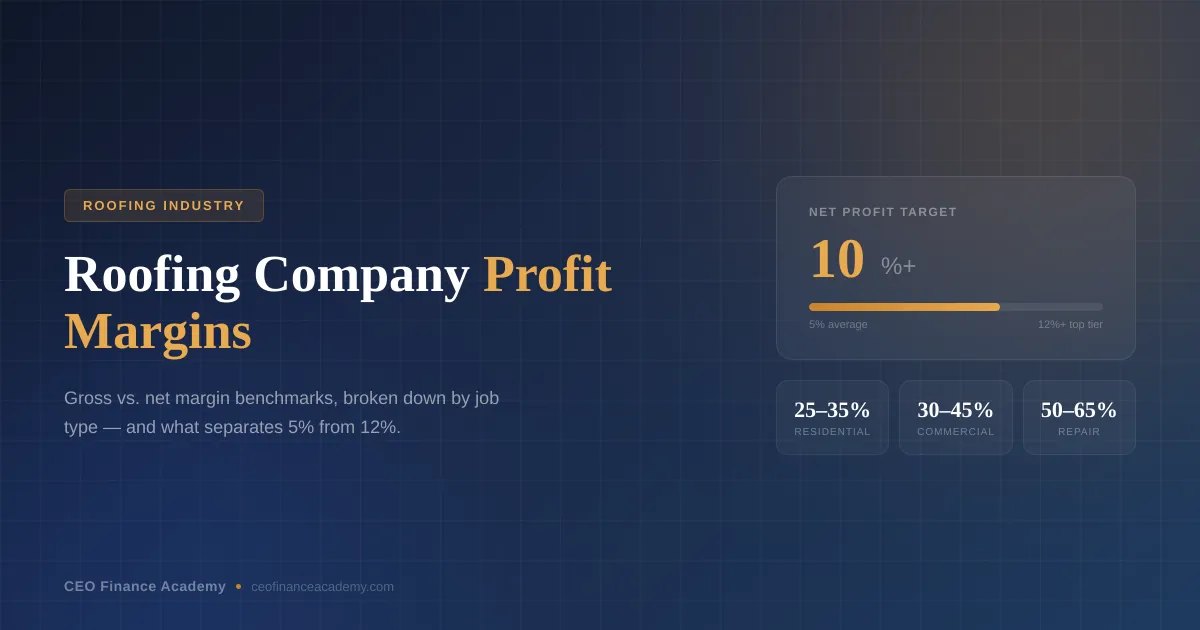
Roofing Company Profit Margin: What You Should Actually Be Making
Here's a question we hear from roofing company owners constantly:
"We did $4 million this year. So why does it feel like I barely made anything?"
If that hits close to home, you're not alone — and you're not bad at business. The roofing industry has a profit margin problem that nobody talks about honestly: the numbers thrown around online (20–40%!) are gross margin figures, not what actually lands in your pocket at the end of the year.
This post is going to break down roofing profit margins the way your CFO should explain them — gross vs. net, by job type, by revenue size, and with real benchmarks you can compare your business against today. Then we'll show you what separates a 5% net margin business from a 12% one, because the gap isn't luck.
Let's get into it.
Gross Profit Margin vs. Net Profit Margin: Why the Difference Matters
Most articles about roofing profit margins cite figures between 20% and 40%. Those are gross profit margins — and while they're useful, they're not the number that determines whether you're actually building wealth.
Gross Profit Margin
Gross profit margin measures what's left after your direct job costs (labor and materials) are subtracted from revenue. It does not include your overhead.
Formula: (Revenue − Direct Job Costs) ÷ Revenue × 100
Example: You complete $500K in roofing jobs in a month. Your materials cost $160K and your labor cost $120K. Your gross profit is $220K — a 44% gross margin. Sounds great. But you still haven't paid for your trucks, your insurance, your office staff, your marketing, or yourself.
Net Profit Margin
Net profit margin is what's left after everything — overhead, owner salary, taxes — is paid. This is the number that actually tells you if your business is creating wealth.
Formula: Net Income ÷ Revenue × 100
Using the same example: after $180K in monthly overhead (office staff, marketing, vehicles, insurance, owner draw), your net income drops to $40K — a net margin of just 8%.
It's entirely possible to run a $5M roofing company with a 35% gross margin and a 4% net margin. You look profitable on paper but you're barely ahead. This is the trap most roofing owners don't see until they have a CFO looking at their full picture.
Roofing Profit Margin Benchmarks: Where Does Your Business Stand?
Based on industry data from the NRCA, Roofing Contractor magazine, and our own work with roofing companies at CEO Finance Academy, here are the benchmarks to measure yourself against:
| Metric | Needs Work | Average | Strong | Best-in-Class |
|---|---|---|---|---|
| Gross Profit Margin | Below 30% | 30–35% | 35–42% | 42–50%+ |
| Net Profit Margin | Below 5% | 5–8% | 8–12% | 12–15%+ |
| Overhead as % of Revenue | Above 35% | 28–35% | 22–28% | Below 22% |
| Labor Cost as % of Revenue | Above 35% | 28–35% | 22–28% | Below 22% |
| Materials as % of Revenue | Above 40% | 32–40% | 26–32% | Below 26% |
A few things worth noting:
- The NRCA reports the average roofing contractor nets just 2.8% — meaning half of all roofing companies make less than that. The industry average is not a good target.
- Strong performers (8–12% net) aren't necessarily doing more revenue. They have better systems, better pricing discipline, and better visibility into their numbers.
- Best-in-class companies (12%+ net) almost always have intentional overhead management and job-level profitability tracking — not just a monthly P&L from their accountant.
Profit Margin by Job Type: Not All Roofing Work Is Equal
This is the insight most roofing owners are missing. Your overall gross margin is an average — but it can be masking the fact that some job types are very profitable and others are quietly destroying your margins.
| Job Type | Typical Gross Margin | Typical Net Margin | Complexity |
|---|---|---|---|
| Residential repair / service | 45–55% | 15–20% | Low |
| Residential re-roof (retail) | 35–45% | 10–15% | Medium |
| Insurance restoration | 30–40% | 8–14% | Medium-High |
| Commercial (small) | 28–38% | 8–13% | Medium |
| Commercial (large scale) | 20–30% | 5–10% | High |
| New construction | 18–28% | 4–9% | High |
The takeaway: Residential repairs and service work are almost always your highest-margin jobs. New construction and large commercial work often look impressive on revenue but erode margins fast when you factor in true overhead absorption, longer payment cycles, and the complexity of managing larger crews.
We've seen roofing companies shift 20% of their revenue mix from new construction toward residential service and re-roofing — and increase net profit by 3–4 percentage points without adding a single dollar of revenue.
Most roofing owners don't know their margin by job type because they're looking at a monthly P&L, not job-level data. A monthly P&L tells you how the whole company did. Job costing tells you which work is actually making you money — and that's a completely different conversation.
Want to Know Where Your Margins Actually Stand?
Book a free 30-minute call with our team. We'll look at your P&L together and show you exactly where the opportunities are.
→ Book My Free CallNo sales pressure · Just an honest look at your numbers
Why You Can Be Profitable on Paper and Still Feel Broke
This is the question we get more than any other from roofing owners doing $2M–$10M in revenue. The business looks good on the income statement. But the bank account is always thin. Here's why:
1. Revenue Doesn't Equal Cash
Your P&L records revenue when you invoice or complete a job. But cash doesn't hit your account until the customer pays — and if you're waiting 30, 45, or 60 days for checks, your cash flow lags your profit by weeks. A single large job with slow payment can create a cash crunch even in a profitable month.
2. You're Funding Your Growth With Your Own Cash
When you take on more work, you spend on materials and labor before you collect payment. At $1M in revenue, this float is manageable. At $5M, a 45-day collection cycle means you might be carrying $500K+ in work that's been done but not paid. That's real cash that's not in your account.
3. Overhead Grows Faster Than Revenue
Most roofing companies scale revenue aggressively but don't actively manage overhead ratios. You hire, buy trucks, expand the office — and overhead goes from 20% of revenue to 32%. That 12-point swing on $5M is $600K that evaporates before you see a dollar of net profit.
4. Owner Salary Is Missing From the Picture
If you're paying yourself below-market and treating that as "keeping costs low," your P&L looks healthier than it really is. A well-structured roofing business at $5M should have a market-rate owner salary built into overhead — and still generate 8–12% net profit on top of that.
5. Taxes Hit at the Worst Time
Roofing is seasonal. You make most of your money Q2–Q3. Your tax bill comes due while Q1 cash flow is thin. Without a rolling cash flow forecast, you can be profitable for the year and still scramble to cover estimated taxes in January.
How to Actually Improve Your Roofing Profit Margins
Here's what the roofing companies we work with do differently — in order of impact:
1. Know Your Numbers at the Job Level, Not Just Monthly
Your accountant gives you a monthly P&L. That's a report card for the whole school — it doesn't tell you which class you're failing. Implement job costing so you can see gross margin on every job type, every crew, and every division. This single change typically surfaces 2–4 points of hidden margin loss within 90 days.
2. Review and Raise Your Pricing — Quarterly
Material costs have risen significantly in the last few years. If you haven't systematically raised prices since 2022, your margins have been quietly eroded. Most roofing owners are underpricing because they set prices once and forget them. Build a quarterly pricing review into your calendar.
3. Track and Control Overhead as a Percentage of Revenue
Set a target overhead ratio and measure against it monthly. If you're at 30% overhead and targeting 25%, you know exactly what you need to cut or grow into. Without a target, overhead just grows on its own.
4. Shorten Your Collection Cycle
Every week faster you collect is cash in your account sooner. Require deposits on jobs over a certain threshold. Use digital invoicing with payment links. Follow up on invoices immediately. Going from 45-day average collection to 30-day on $5M in revenue frees up roughly $200K in working capital.
5. Build a Rolling Cash Flow Forecast
A 13-week cash flow forecast is the difference between reacting to cash problems and preventing them. It maps every dollar of expected revenue and expense out 90 days so you can see the crunch coming and act before it arrives — not after.
6. Optimize Your Job Mix
Based on your job-level margin data, intentionally shift your revenue mix toward higher-margin work. You don't have to turn down low-margin jobs entirely — but knowing which work to prioritize, market more aggressively, and charge more for is a strategic advantage most of your competitors don't have.
What a Financially Healthy Roofing Company at $1M–$10M Looks Like
Here's a rough profile of a well-run roofing business at different revenue levels, based on what we see in our CFO client work:
| Metric | $1M–$2M | $3M–$5M | $7M–$10M |
|---|---|---|---|
| Gross Margin | 35–42% | 38–44% | 36–42% |
| Net Margin | 7–11% | 9–13% | 8–12% |
| Overhead Ratio | 24–30% | 25–30% | 27–33% |
| Owner Salary (in overhead) | $80–120K | $120–180K | $180–250K |
| Cash Reserve Target | 1–2 months opex | 2–3 months opex | 2–3 months opex |
Notice the net margin doesn't automatically improve as revenue grows. Some of the tightest-margin roofing companies we've seen are running $8M+ businesses with a 4% net — because overhead scaled with revenue and nobody was managing the ratio. Bigger doesn't mean more profitable. Better-managed does.
The Role of a Financial Co-Pilot in Hitting These Numbers
The roofing companies hitting 10%+ net margins consistently share a few things in common. They look at financials weekly, not quarterly. They know their job margin by type. They have a rolling cash flow forecast. And almost without exception, they have someone in the financial co-pilot seat — either a strong internal CFO, a fractional CFO, or a financial coach who understands the trades.
This isn't coincidental. Financial clarity is a competitive advantage in the roofing industry. When you know your numbers deeply, you price better, hire smarter, and make strategic moves before your cash forces you to react.
Most roofing owners we talk to say the same thing: "I wish I had done this sooner." The cost of not having financial visibility isn't just the margin you're leaving on the table — it's the decisions you're making without the information you need.
The Bottom Line on Roofing Profit Margins
A healthy roofing company at $1M–$10M should be targeting:
- 35–44% gross profit margin
- 8–12% net profit margin (after all overhead and a real owner salary)
- Overhead ratio below 30% of revenue
- Job-level margin visibility across all major work types
If your numbers aren't there yet, the gap almost always comes down to three things: pricing discipline, overhead management, and visibility into where the margin is actually leaking. None of those are things you can fix by looking at a monthly P&L from your accountant — you need job-level data and a forward-looking financial system.
That's exactly what we help roofing companies build at CEO Finance Academy.
Find Out Where Your Margins Are Leaking
Book a free call with our team. We'll look at your numbers together — no pitch, just an honest conversation about where you stand and what it would take to hit 10%+ net.
→ Book My Free CallFree call · No sales pressure · Just an honest look at your numbers